Programmable Breakpoints with the Debugger Statement
Because setting a breakpoint in the developer console can be a little unwieldy, you can use the debugger; statement inside your Javascript code to pause execution at that point.
While breakpoints are a great way on their own to inspect the current state of your application, you may want to pause execution at a specific point in your code without having to set a breakpoint in the developer console.
Of course, you never want to leave a debugger; statement in your code when you are done debugging the current problem - it will pause execution every time it is hit, including in production.
Here is a simple example of how you might use the debugger; statement in your code:
function multiply(x, y) {
    debugger;
    return x * y;
}
When you run this code in your browser, the developer console will pause execution at the debugger; statement. You can then inspect the current state of your application, including the values of x and y.
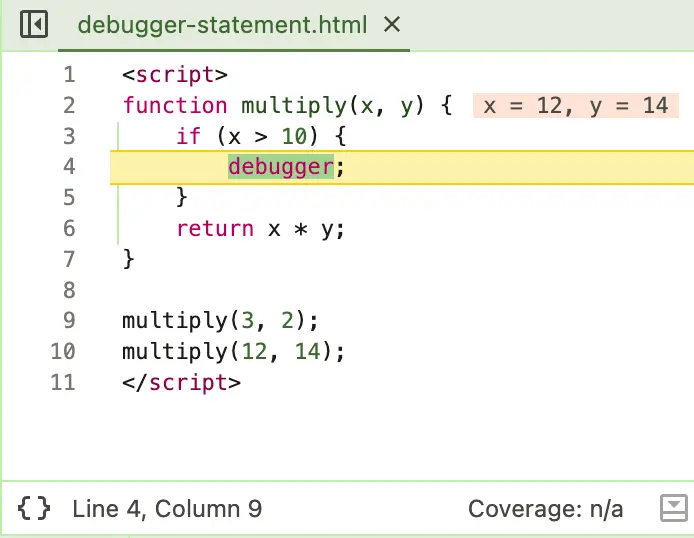
One power tip is to use the debugger; statement in a conditional block - this way, you can pause execution only when a certain condition is met.
function multiply(x, y) {
    if (x > 10) {
        debugger;
    }
    return x * y;
}
Here’s how this would look in the developer console:
You can also do the same thing with a conditional breakpoint in the developer console, but this can be a little bit more complicated to set up, especially if you have a complicated condition.
Just be sure to remove the debugger; statement before you push your code to production!